Gold Price Forecast: XAU/USD eyes deeper losses if $1805 support caves in – Confluence Detector
- Gold price starts August in the red amid a rebound in risk appetite ahead of ISM.
- US infrastructure bill optimism, DYX weakness fails to offer reprieve to gold bulls.
- Gold: Bulls hesitate as focus shift to NFP.
The downbeat tone around gold price remains unabated this Monday, as the bears extended their control after Friday’s steep drop. The progress on the US infrastructure bill and broad US dollar weakness fail to offer any reprieve to the bulls, as gold price heads towards the $1800 mark. The risk-on rally in the global stocks combined with stabilizing Treasury yields weighs negatively on gold price. Investors also ignore the mounting tensions surrounding the Delta covid variant spread globally. Attention now turns towards US ISM Manufacturing PMI and corporate earnings reports for fresh trading impulse.
Gold Price: Key levels to watch
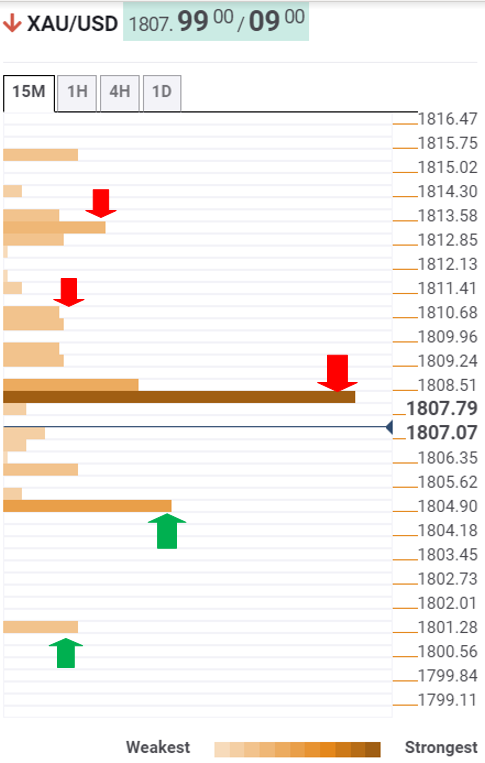
The Technical Confluences Detector shows that gold has breached powerful support at $1808, which was the convergence of the Fibonacci 38.2% one-month, SMA50 four-hour and SMA10 one-day.
Therefore, sellers now target the $1805 support, where the Bollinger Band one-hour Lower lies.
The next relevant cushion awaits at the SMA100 one-day at $1801, below which a drop towards the previous week's lows around $1790 cannot be ruled out.
If the buyers recapture the abovementioned key support at $1808, which has now turned into resistance, gold price could seek a retest of the SMA100 four-hour at $1810.
Further up, $1813 could act as a stiff resistance. At that point, the SMA100 one-hour coincides with the previous high four-hour and SMA5 four-hour.
The Fibonacci 23.6% one-day at $1816 could be the next target of interest for gold bulls.
Here is how it looks on the tool
About Technical Confluences Detector
The TCD (Technical Confluences Detector) is a tool to locate and point out those price levels where there is a congestion of indicators, moving averages, Fibonacci levels, Pivot Points, etc. If you are a short-term trader, you will find entry points for counter-trend strategies and hunt a few points at a time. If you are a medium-to-long-term trader, this tool will allow you to know in advance the price levels where a medium-to-long-term trend may stop and rest, where to unwind positions, or where to increase your position size.

